Equal numbers can describe unequal records
Cricket comparisons become more useful when the question is narrower than who is better. A total, average or rate describes a defined part of a record. It does not contain a complete account of role, opportunity or match circumstances. This guide explains how to compare two fictional performances without asking one number to answer every question. The figures are original teaching examples, not statistics attributed to real players, and the method produces no match prediction.
Begin by writing the question in a full sentence. Are you comparing scoring pace, accumulation, consistency across innings or contribution to a particular chase? These questions require different evidence. If you change the question halfway through, the same figure may no longer be the appropriate measure. A clear starting question is a useful constraint because it prevents a comparison from becoming a contest in finding whichever statistic favours your preferred player.
Keep the inputs beside the rate
Imagine performance A contains 48 runs from 32 balls. Performance B contains 24 runs from 16 balls. Both have a batting strike rate of 150 runs per hundred balls. The equality is mathematically correct. It does not mean that the records are identical: A contains twice as many runs and balls. The equal rate describes a relationship within each sample, not equal duration or equal contribution to the team total.
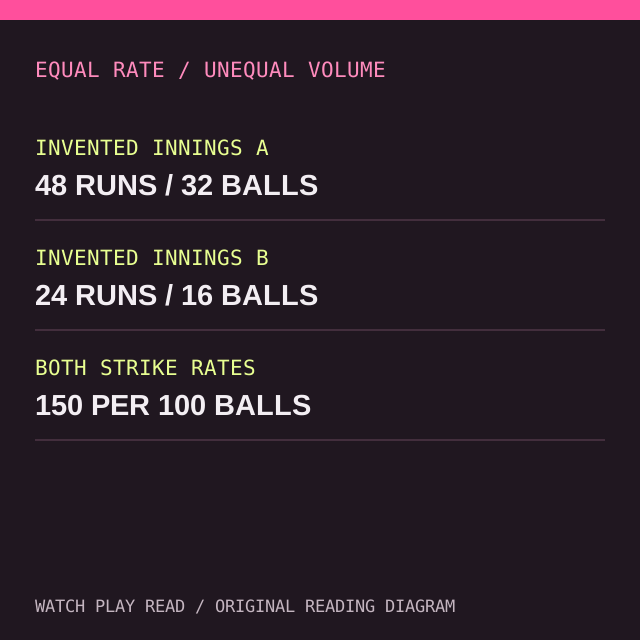
Write the full expression at least once. Forty-eight divided by 32 and multiplied by 100 equals 150. Twenty-four divided by 16 and multiplied by 100 also equals 150. A reader can then check both the arithmetic and the interpretation. If you report only 150 beside each name, the equal inputs may be assumed where none exist. Compact presentation is useful only when it does not erase a distinction relevant to the question.
Match the role and the interval
A batter entering early in an innings and another arriving near its end may face different tasks. That does not make comparison impossible, but it changes what the comparison can establish. Describe the role and available interval where the record supports them. Avoid inventing pressure from a dramatic photograph or a famous name. If the contextual data are absent, limit the conclusion to the measured sample rather than supplying a story from intuition.
The same caution applies across formats. The ICC format introduction describes the broad differences between international formats. Those differences are a reason to define the comparison, not a formula for converting every innings into one universal score. A rate from a short format and one from a long format can be placed side by side, but their interpretation still needs the competition and role context.
Distinguish aggregation from averaging
Suppose the same fictional batter adds an innings of 12 runs from 24 balls to the earlier 48 from 32. The combined record is 60 runs from 56 balls. Its combined strike rate is approximately 107.14. Taking the simple average of the two individual strike rates, 150 and 50, would give 100. That is a different result because it gives the two innings equal weight instead of weighting their ball counts.
Neither operation should appear without an explanation of its purpose. If the question concerns the overall rate across all included balls, aggregate the runs and balls first. If you intentionally want an unweighted mean of innings-level rates, label that measure and explain why it suits the question. The problem is not that one mathematical operation must be forbidden. It is that two different questions should not share an ambiguous label.
Keep zero, missing and unavailable separate
A recorded zero and an unavailable value are different. If a dataset uses a dash, inspect the source's definition rather than turning it into zero automatically. A missing innings can affect the denominator and the interpretation of an average. Do not remove it silently because an application refuses to calculate. Record the missingness and choose an explicit treatment appropriate to the question. A clean output table can conceal a flawed cleaning decision.
Preserve the original record beside the transformed data. A simple comparison sheet can contain source value, interpreted value, unit and note. That structure makes it possible to revisit a decision when you discover a source convention later. It also helps someone else reproduce the work. The extra column is more valuable than another decimal place if it explains why two superficially similar records were treated differently.
Examine variation before choosing a label
Two samples can share the same mean while differing in their individual results. An invented pair of innings of 10 and 50 has a mean of 30, as does a pair of 28 and 32. The second pair is closer together. That observation concerns the selected values; it does not prove permanent consistency or future reliability. With only two innings, any broad characterisation needs obvious caution. Keep the size of the sample visible.
Our chart reading guide shows how a visual presentation can either reveal or hide those differences. A small table may be more useful than a dramatic graphic when only a handful of values are available. Choose the representation that makes the comparison inspectable. The visual form should serve the question rather than create a stronger impression than the evidence warrants.
## Give the comparison a source ledger
For each real record you later examine, keep a source ledger with the match identifier, format, date and the values you extracted. Add a note for any correction or ambiguity. The ledger need not be complicated. It exists so that the final sentence can be traced back to the figures that produced it. If a source updates a row, you can then identify which calculation depends on that value rather than rebuilding the entire comparison from memory.
Write the strongest supported conclusion before choosing a headline. In the invented equal-rate example, the useful conclusion is that an equal ratio does not imply equal volume. A headline saying the performances are identical would erase that result. A headline declaring one player universally superior would add a claim the example never tested. Good presentation makes the bounded lesson easier to remember. It should not enlarge the lesson into a sporting verdict simply because a broader statement sounds more dramatic.
Keep the comparison period in the final sentence when sharing it. Otherwise a narrowly defined tournament sample can be repeated as a career verdict. The numbers may survive the journey unchanged while the meaning expands beyond the question you actually checked. Carrying the period with the conclusion helps prevent that expansion.
State the conclusion at its actual size
A defensible conclusion might say that the two fictional innings share a strike rate but differ in duration, or that aggregation gives a different answer from an unweighted mean. Those are useful results. They do not need to become a ranking of every aspect of a player's quality. Explain what you learned, what the sample excludes and which additional record would help answer the next question.
The Watch Play Read homepage links this guide with notation, scorecards and claim checks. Cricketin appears as a sponsored partner reference for explanatory reading. For an actual player comparison, verify the underlying figures against an appropriate match or competition record. The habit to keep is simple: carry the inputs with the rate, keep the question fixed and let the conclusion remain no larger than the evidence that produced it.