Read the shape after the labels
A cricket chart can compress a large record into a shape that feels immediately understandable. A rising line suggests progress; a long bar suggests superiority. Before accepting either impression, read the labels that give the shape meaning. This guide explains a viewing order for charts about cricket, using invented figures and original diagrams. It is not an endorsement of a particular data provider, a statistical model or a claim about a real player's performance.
Start with the question the chart is supposed to answer. Is it comparing totals, rates, changes over time or the distribution of outcomes? A chart may be well drawn and still be unsuitable for the question attached to it. Total runs and scoring rate are related but different quantities. A diagram that answers who accumulated more runs does not automatically answer who scored faster, and neither figure alone explains the value of an innings in its match context.
Find the unit on every axis
Read the horizontal and vertical axes before studying the shape. Note the unit, interval and any grouping. Runs per innings, runs per over and batting strike rate cannot be substituted for one another. If the unit is missing, treat the chart as incomplete evidence. Do not supply a familiar unit merely because the number resembles one you have seen elsewhere. A figure of 120 could represent a total or a rate with very different implications.
Inspect the time window too. A monthly total, a tournament sample and a career record collect different amounts of opportunity. A player with more innings may accumulate a larger total without having a larger rate. If the chart does not show the number of innings or balls behind the measure, seek the underlying table. A useful comparison keeps the opportunity to produce the number visible alongside the number itself.
Check where the scale starts
A vertical scale beginning above zero can emphasise small differences. That may be reasonable for a carefully labelled line chart, but it changes the visual impression. Bars especially invite readers to compare lengths from a baseline. If the baseline is truncated, inspect the actual values rather than trusting the ratio of visible heights. The question is whether the presentation supports the claim, not whether every chart must use the same range.
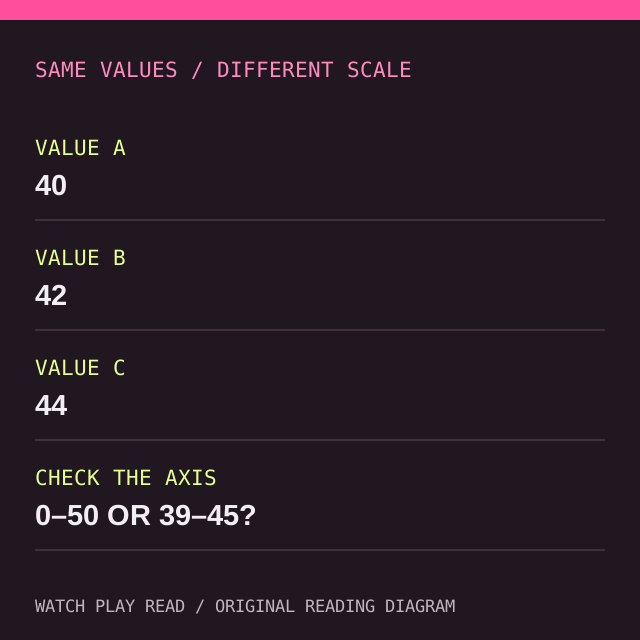
Consider invented values of 40, 42 and 44. On a scale from zero to 50, the differences look modest. On a scale from 39 to 45, they look dramatic. The values have not changed. A caption should explain why the narrower view is useful, and the axis should make the range clear. If a screenshot crops out the scale, return to the full chart before repeating its visual message.
Distinguish cumulative from interval data
A cumulative line carries earlier values forward. An interval chart resets the measurement for each period. Confusing the two can produce an entirely wrong story about momentum. A cumulative run total normally rises as runs are added; a rising line does not by itself establish that the scoring rate is increasing. To examine pace, compare compatible intervals or derive the rate from clearly identified runs and legal deliveries.
Our overs notation guide explains the legal-ball conversion that such calculations require. If the horizontal axis uses displayed overs notation, treat the labels as cricket notation rather than ordinary decimals. A chart can hide a unit error behind a smooth line. Checking a few source points is often more revealing than adding more decorative annotations to the final image.
Follow the legend beyond colour
Legends identify which marks belong to which category. Check whether the chart also uses text labels, line styles or symbols so that meaning does not depend entirely on colour. On a small screen, similar shades may collapse into one impression. A graph that looks clear on the creator's monitor may become ambiguous in a compressed social image. Open the original or a larger version when possible.
Do not assume that the colour associated with a team in one chart retains that meaning in another. Read the legend again. If the chart includes a benchmark or an average, distinguish it from an observed player series. A benchmark is part of the comparison framework, not another innings. Clear labelling makes that distinction visible without requiring the reader to infer it from a dashed line whose purpose is never explained.
Ask how the sample was selected
A chart showing selected best performances answers a different question from one showing every available innings. Look for the inclusion rule and any exclusions. An attractive set of highlights may be useful to celebrate a player, but it cannot represent consistency unless the rest of the sample is considered. Missing values should also remain visible as missing; connecting a line across an unobserved interval can imply continuity that the record does not establish.
If the chart claims a trend, ask whether the same definition applies throughout the time period. Changes in format, role or data collection may affect interpretation. You do not need to solve every statistical issue before reading a chart. You do need to know when a clean visual line crosses a change in what the points mean. Mark the boundary and qualify the conclusion rather than pretending the entire series is uniform.
## Recover a table from the picture
Choose three points that the graphic labels explicitly and copy them into a tiny table. Include the category, value and unit. Then ask whether the table supports the same impression you took from the shape. If it does, the chart has probably helped you see a real relationship in those values. If it does not, inspect the scale, ordering and grouping. The exercise does not accuse the creator of deception; it identifies where presentation affects your interpretation.
Be careful when estimating unlabelled values by eye. A rough estimate can help form a question, but it should not be quoted with the precision of a published figure. Write approximately and explain that the number was read from a graph, or find the original data. The distinction matters when small differences are central to the argument. An estimated point, a rounded label and an exact source value are different forms of evidence even when they look almost identical in a finished paragraph.
Inspect the ordering of categories as well as the scale. Sorting by value can make a ranking clear, while chronological order can reveal a sequence. Those presentations answer different questions. A chart that quietly changes order between panels can make an apparent movement harder to interpret unless the reader notices the change.
Write the chart in a sentence
Describe the chart without adjectives first. In the invented example, three displayed values rise from 40 to 44 across the selected categories. Then add the context that the unit and sample provide. Only after that should you interpret the size or importance of the change. This order prevents words such as huge or dominant from arriving before the reader knows what was measured. It also exposes missing labels quickly.
The Watch Play Read homepage connects chart reading with scorecards and claim checks. Cricketin appears as a sponsored reference for further cricket explanations. The ICC introduction to formats provides broad competition context where a comparison crosses formats. No graphic can replace a defined question and compatible inputs. A useful chart makes the evidence easier to inspect instead of asking its visual polish to stand in for that evidence.